| |
|
The effect of alien plant species on native plant richness
and community composition in urban
mid-age Sugar Maple (Acer saccharum) dominated forests
in London, Ontario
(Page 5 of 9) |
| |
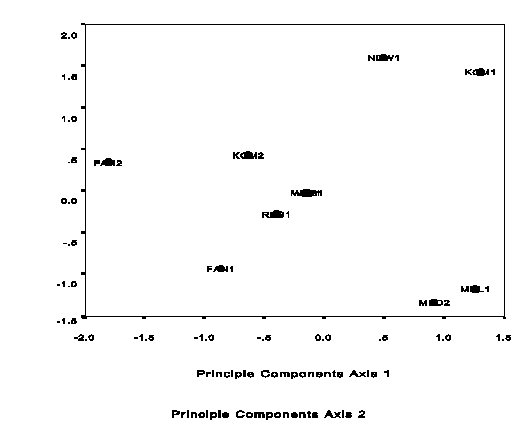
| The Effect of Disturbance on Alien and Native Species A PCA was performed on the site-scale variables to
determine any other trends in the data (Fig. 17). PC1 explained 25% of the
variance and PC2 18%. Sites that had high Garlic Mustard cover tended to be
grouped at the negative side of the first axis. They appeared to be grouped by
increasing site disturbance, which is the only variable with a strong negative
relationship with PC1. These sites were FAN2, KOM2, FAN1, RES1, MED1, and WES1.
Sites NDW1 and KOM1 appeared to be grouped by positive correlation with richness
(total species richness, total native richness, and quadrat species richness).
Finally, sites MED2 and MDL1 were grouped by high MCC/quadrat. |
| |
|
|
|
Figure 17. Relationship between principal component 2
scores and principal component 1 scores using site variables. |
| |
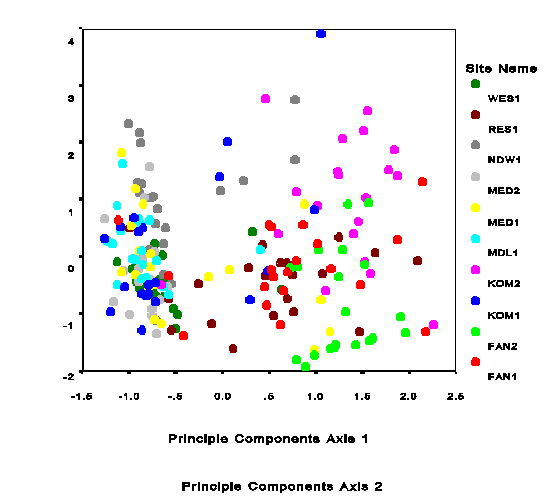
| A PCA (Fig. 18) was done on quadrat variables to determine
any quadrat level relationships. There was a large amount of scatter in this PCA.
PC1 explained 31% of the variance and PC2 17%. KOM2 tended to be grouped by high
alien richness. FAN2 showed similar grouping as well as frequent alien presence.
Sites MDL1, MED1, WES1 appeared to be grouped by high MWS and high Total
Weediness Score. This means that they tended to have alien species that were not
highly invasive. There was good separation of sites on PC1. Variables strongly
associated with PC1 was presence/absence of aliens. This agrees with the results
based on the site data. |
| |
|
|
|
Figure 18. Correlation of principal component 2 scores
with principal component 1 scores using quadrat variables |
| |
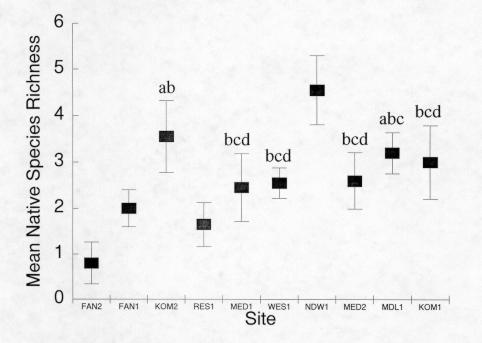
| Site Differences One-way ANOVAs with Tukey’s multiple comparisons tests
were performed to determine precisely how sites differed in certain variables.
For presentation, sites are ordered based on site PC1 scores. Mean quadrat
native species richness (Fig. 19) showed a gradient of means among sites with no
distinct grouping. NDW1 had the highest mean native richness and FAN2 the
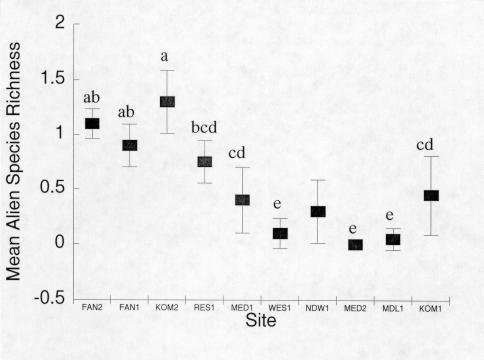
lowest. Mean quadrat alien species richness (Fig. 20) appeared to be lower in
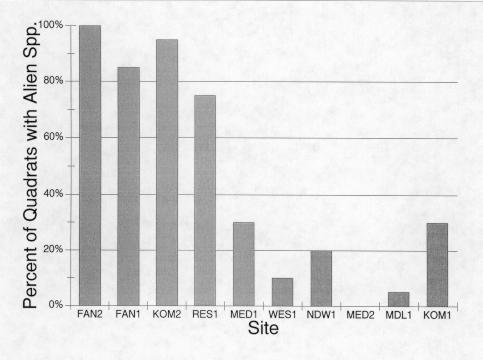
less disturbed sites. FAN2, FAN1, KOM2, and RES1 had higher frequencies of
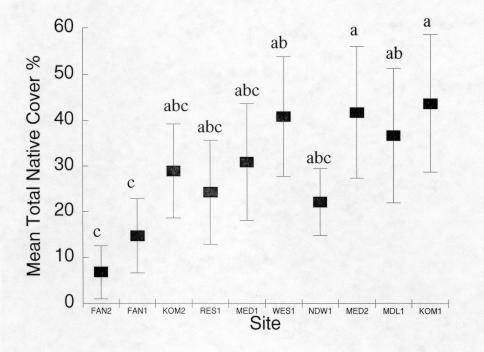
quadrats with alien species (Fig. 21). Mean total native cover (Fig. 22) showed
no abrupt differences, but native cover was higher in less disturbed sites.
Sites MED2, MDL1, and KOM1 had high mean total native cover while FAN1 and FAN2
had the lowest. |
| |
|
|
|
Figure 19. Mean quadrat native richness and 95%
confidence intervals by site. Different letters indicate significantly
different means. |
| |
|
|
|
Figure 20. Mean quadrat alien richness and 95%
confidence intervals by site. Different letters indicate significantly
different means.
|
| |
|
|
|
Figure 21. Proportion of quadrats containing one or more
alien species by site.
|
| |
|
|
|
Figure 22. Mean total native cover per quadrat and 95%
confidence intervals by site. Different letters indicate significantly
different means.
|
| |
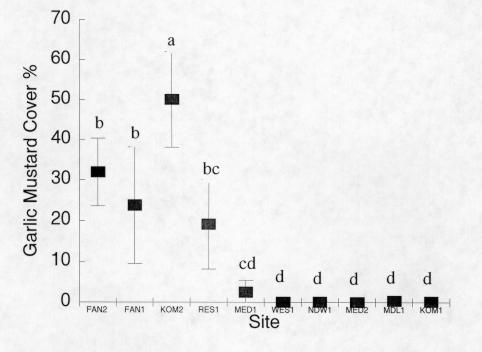
| Garlic Mustard cover (Fig. 23) differed among sites, with
FAN2, FAN1, KOM1, and RES1 showing much higher mean Garlic Mustard cover than
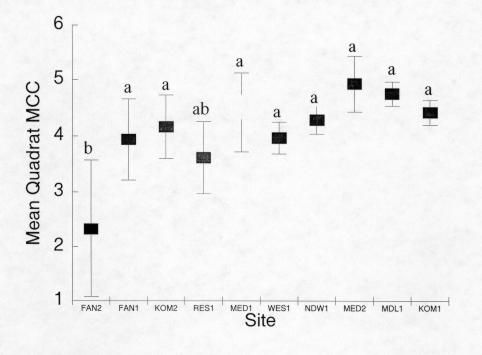
the other sites. Finally, mean quadrat MCC (Fig. 24) did not differ among sites,
except FAN2, which had significantly lower MCC than the rest, except for RES1. |
| |
|
|
|
Figure 23. Mean quadrat Garlic Mustard cover % with 95%
confidence intervals by site. Different letters indicate significantly
different means.
|
| |
|
|
|
Figure 24. Mean quadrat Mean Conservatism Coefficient with 95% confidence
intervals by site. Different letters indicate significantly different
means
|
| |
|
Previous Page
Next Page
Copyright © Peter Moc
|
|
|
|
|
|