| |
|
The effect of alien plant species on native plant richness
and community composition in urban
mid-age Sugar Maple (Acer saccharum) dominated forests
in London, Ontario
(Page 4 of 9)
|
| |
| Relationships Between Native and Alien Cover Abundance Plant species abundances were compared using percent cover
values, taken at the mid-points of the Domin-Cover-Abundance intervals. Alien
plants often have high abundance, even though richness is relatively low. There
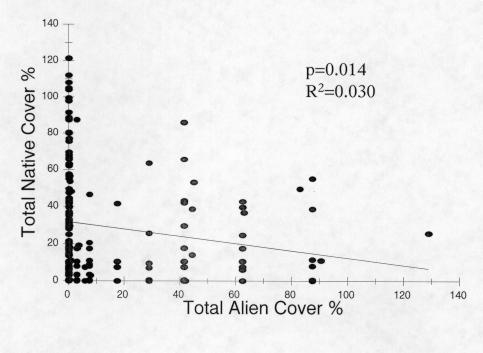
was a significant (p<0.01), negative relationship between native cover and
alien cover (Fig. 9). However, this was quite weak (R2=0.030). Total native
cover decreased with increases in total alien cover.
Garlic Mustard (Alliaria petiolata), was the dominant alien species
and the main species of interest in this study. Garlic Mustard cover accounted
for 92% (p<0.01) of the variation in total alien cover. Therefore, it is
used, in this study, as an effective measure of alien cover. Garlic Mustard
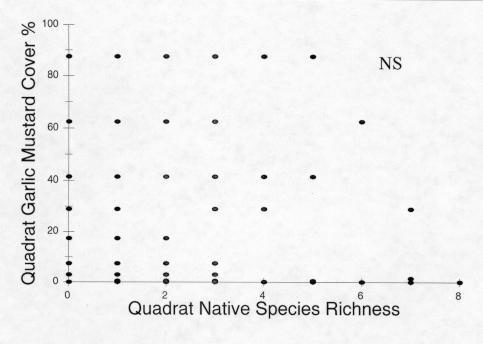
cover did not significantly affect native richness (Fig. 10).
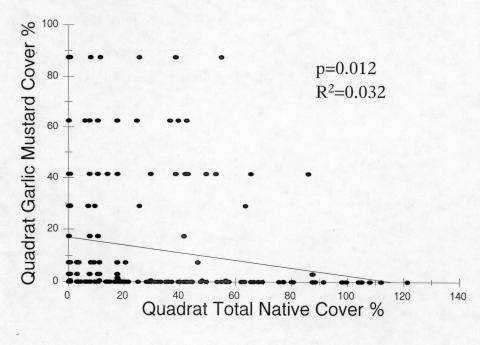
Total native cover was negatively related to Garlic Mustard cover (Fig. 11).
Although this relationship was significant (p=0.012), the amount of variation
explained was low (R2=0.032).
|
| |
|
|
|
Figure 9. Relationship between total native cover and
total alien cover within quadrats.
|
| |
|
|
|
Figure 10. Relationship between Garlic Mustard cover and
native richness within quadrats. NS indicates a non-significant
relationship.
|
| |
|
|
|
Figure 11.Relationship between Garlic Mustard cover and
total native cover within quadrats. |
| |
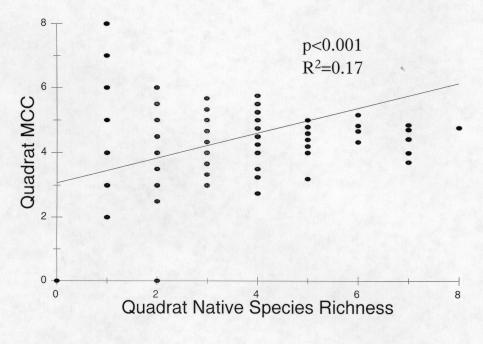
| Alien Richness and Native Species Community Composition Mean Conservatism Coefficient (MCC) per quadrat was tested
against native richness per quadrat (Fig. 12). The relationship was positive and
highly significant (p<0.001), but weak (R2 =0.17). Thus, sites
with a greater number of native species tended to have a greater community
importance of conservative plants.
|
| |
|
|
|
Figure 12. Relationship between quadrat Mean Conservatism
coefficients and quadrat native species richness.
|
| |
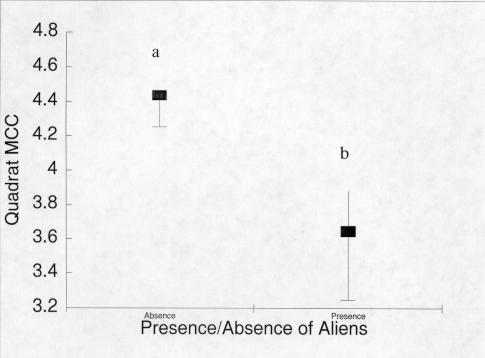
| MCC was tested in the presence and absence of alien
species (Fig. 13). The difference was highly significant (p<0.0001) with MCC
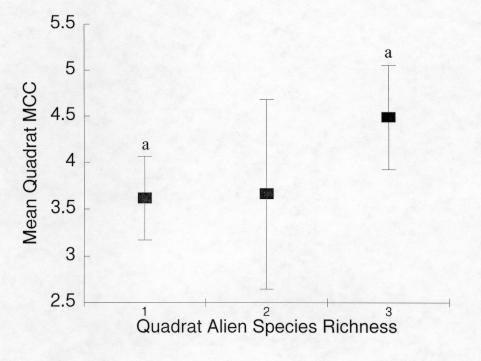
higher in the absence of aliens. MCC was also tested to determine if there were
differences between quadrats with different numbers of alien species (Fig. 14).
The difference was not significant (p>0.05). The general trend was similar to
the relationship between mean native richness versus alien richness (Fig. 8). |
| |
|
|
|
Figure 13. Quadrat Mean Conservatism Coefficient in the presence or
absence of alien species with 95% confidence intervals. Different letters
indicate significantly different means.
|
| |
|
|
|
Figure 14. Quadrat Mean Conservatism Coefficient in the
presence of varying numbers of alien species with 95% confidence
intervals. Different letters indicate significantly different means. |
| |
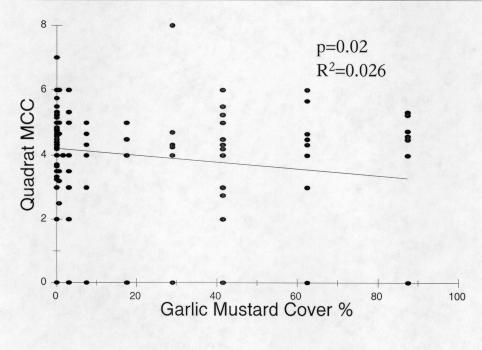
| MCC was tested against garlic mustard cover (Fig. 15) to
see if greater Garlic Mustard cover reduced the community importance of
conservative plants. This relationship was indeed negative and significant
(p<0.05). It was weak however, with R2=0.026. |
| |
|
|
|
Figure 15. Relationship between quadrat Garlic Mustard
cover and quadrat Mean Conservatism Coefficients. |
| |
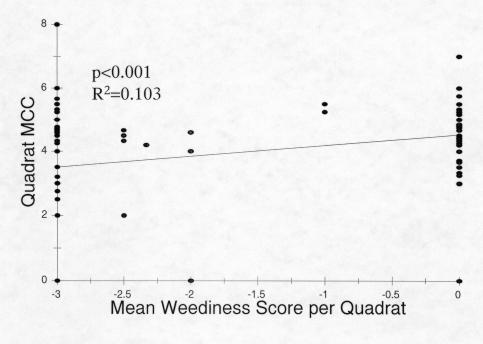
| The relationship between MCC and MWS was also tested (Fig.
16). This relationship was highly significant (p<0.001), but fairly weak (R2=0.103).
It should be kept in mind that a lower MWS means that there is a greater
representation of strong weeds due to the negative scale. Therefore, the more
invasive weeds were associated with the less conservative native plant species. |
| |
|
|
|
Figure 16. Relationship between quadrat Mean Weediness Score and quadrat
Mean Conservatism Coefficient.
|
| |
|
Previous Page
Next Page
Copyright © Peter Moc
|
|
|
|
|
|